What's happening on my street? Residents tell the story
• Written by Dave Driesmans on 10 July 2026
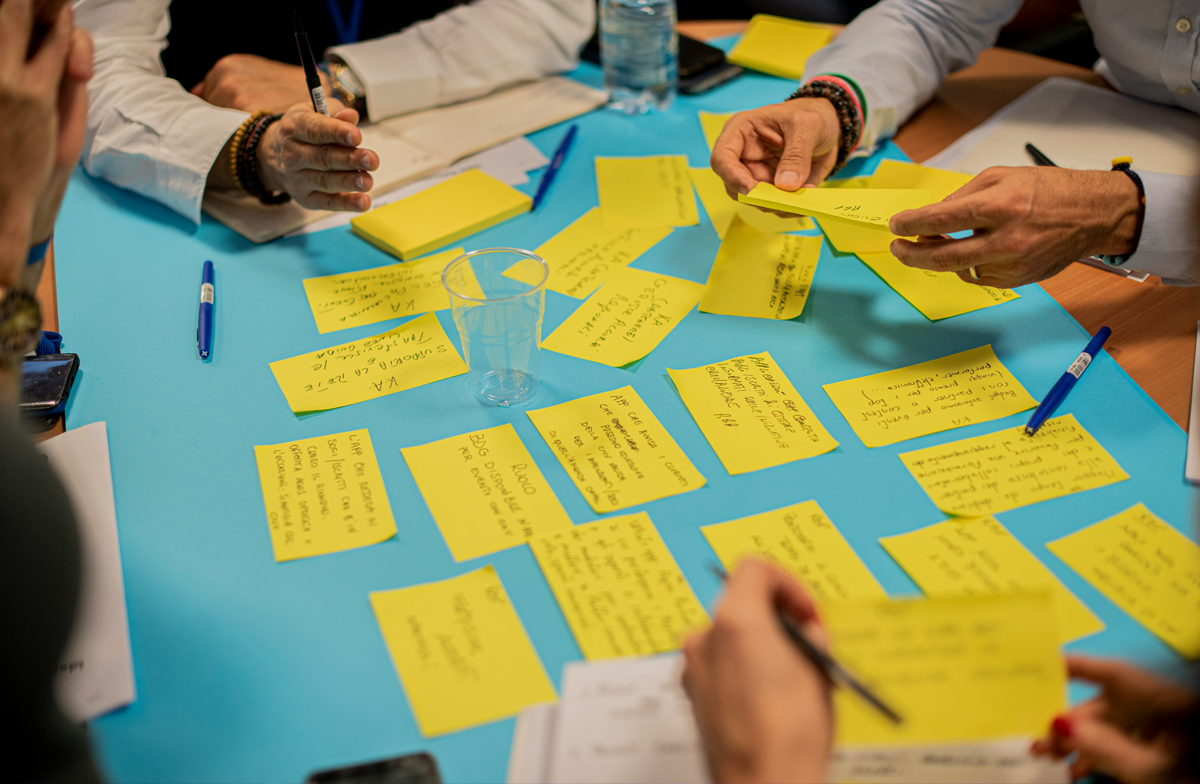
Data shows what is happening, but not always why. That is exactly where Telraam can further set itself apart from classic counting systems, thanks to its community of counters. A pneumatic tube counter or a traffic camera records the numbers neatly enough, but the context behind that count remains a blind spot. Telraam doesn't count just anywhere: a sensor hangs at the home of a resident who knows their street inside and out. That person can explain why a given day or week looked different.
With Telraam, we're building on this and now want to start collecting that contextual information systematically. We're making sure residents help not only by gathering the counts themselves, but also by providing explanations for what they observe.
Tested in practice, together with residents
Flemish Brabant has a very dense network of Telraam devices with interesting data. This is where Telraam took its very first steps. Trying out these new features in our own region seemed like a good idea.
In a series of workshops and try outs, we spoke with interested residents, consultancy firms and policymakers. What do they grasp right away, and where do they lose interest? What questions do they have about their street? And what do they know themselves about their counts that never shows up in the data? The same thread kept coming back: residents are sitting on a wealth of information that isn't captured today and is often overlooked, not least by traffic experts themselves!
That very observation formed the basis for what we built. So not necessarily starting from a technical or traffic engineering angle, but from the users themselves. The result was successfully introduced as a module in a few Telraam networks. Ready for the next step! (*)
Adding context and feedback to your data
A Telraam network can now allow users to add context and feedback to the count data. Do you see a deviation you can explain? With a few clicks, you can add local knowledge to the data.
- "There was a neighborhood party this week, hence the busy Thursday evening."
- "The drop is due to the redesign of the intersection. The street was partially closed."
- "During school holidays, morning traffic here is always lower."
Nobody knows a street better than the people who live there. By linking that knowledge to the data, every measurement becomes richer and every analysis more reliable. It also gives the insights we draw from it a stronger scientific footing.
Available as a module, rolling out gradually
The feature is now available as a separate module. You can enrich count data with text based context, for one short period, for a longer period, or for a recurring pattern (think of a weekly market or school holidays). This lets network managers keep a simple overview of what was added where, across all their networks.
We're rolling it out step by step across the different networks, so we can adjust along the way based on your experience. Is your network not on board yet? Feel free to get in touch with us about it.
What's next?
Right now, you can provide contextual information on your own initiative, based on what you've noticed yourself. It would be even better if we could notify users whenever a striking deviation is spotted. This flips the logic around: using automated data analysis techniques, Telraam itself will spot the notable patterns, an unusual peak, a sudden drop, a shift that doesn't fit the street's normal rhythm.
Instead of you having to notice that deviation, the system will soon bring it to your attention proactively. Think of smart, personalized notifications: "There was a pedestrian spike on your street in the past hour. Does this ring a bell?" This way, we move from passive numbers to active insights, so that as a resident or policymaker you can step in in time whenever it's needed.
Try out the new module as soon as it appears in your network and let us know what you think. We'd love to hear from you!
(*) All of this fits within DataLens, a Slimme Regio project funded by the province of Flemish Brabant, in which we, together with Sentigrate, Transport & Mobility Leuven, KU Leuven and citizen collectives in Tienen and Asse among others, turn traffic counts into accessible insights.