Some insights on Telraam data validation
Precision, accuracy, and validations of the original Telraam sensor • Written by Robert McIntosh on 28 July 2022

Author: Dr. Péter I. Pápics
Since the start of Telraam, our original Raspberry Pi-based sensors have counted three billion road users over approximately 5000 different locations (by July 2022). We have published an extensive white paper (click here) about how our sensor counts and classifies objects into the four traffic modes (heavy vehicles, cars, cyclists, and pedestrians), explaining how the initial calibration of the method was done using data from the three first Telraam prototypes, that the expected accuracy strongly depends on the placement of the sensor, and we provided feedback on the validation data that we have received from various sources to establish the accuracy and the precision of our sensor. In this article we provide a detailed summary on precision and accuracy, as a reflection to the validation counts and experience that we have collected over the years.
Definitions
To be able to fully understand the significance of the numbers that will follow below, we have to first define a few concepts.
Precision relates to the scatter of a set of measurements around a mean value. In Telraam terms, imagine that we could place a hundred Telraam sensors at the same location, and they counted on average a 100 vehicles per hour, with a scatter of +/- 3. This would mean that we have a 97% precision (an error margin of 3%). Therefore precision can also be understood as repeatability or reproducibility.
Accuracy relates to how close our measurements (actually, the mean of the measurements as defined above) are to the real traffic volumes (often referred to as the ground truth). Unfortunately it is possible to have low accuracy even with high precision. For example imagine that in our example the real traffic is 150 vehicles per hour, and we have measured 100+/-3 vehicles across a hundred sensors. This would mean that our accuracy is only 67% (an error margin of 33%, 10 times worse than the error related to the precision), and it could be a result of an intrinsic systematic error (e.g. a problem in the computer vision algorithm), or an external error-source (such as standing still traffic near a traffic light, parked cars blocking one of the traffic lanes, etc.).
What is generally referred to as single measurement accuracy is therefore a combination of these two terms (and in our example the dominant contributor is the 10 times worse accuracy). A single measurement can only be guaranteed to be accurate for sure, if the applied measurement technique can be described as both highly precise and highly accurate. If either the precision or the accuracy is low, then there is no guarantee that a single measurement will be accurate.
Validation
We have not carried out systematic tests on the precision of the original Telraam sensor, but simply because of the techniques used (e.g., a relative high resolution camera - compared to AI vision techniques -, a fixed field of vision, a fixed classifier, etc.), the sensor to sensor scatter is expected to be very low (~ a few percent), therefore it is safe to assume that the precision of the sensor is high, and it is not a significant contributor to the final perceived measurement error.
Accuracy can be tested by performing validation counts, meaning that simultaneously with a counting Telraam, we need another credible source which can provide us with the ground truth for the measured interval in question. In practice this mostly involves manual traffic counts, where citizens simply note down the road users passing in front of their window by direction and by traffic mode. In other cases it might be data coming from a well tested and validated alternative counting method, such as pneumatic (pressure) tubes, but since these traffic counts are often carried out in the framework of a commercial venture, getting such data is only possible in very rare cases. Then by comparing the validation data to the Telraam data, we can check the accuracy of that single Telraam. Since we already argued that the precision of Telraam is very high, the accuracy derived from even a single measurement (one hour’s data) can be considered a good estimate of the accuracy of the Telraam on that specific location, assuming no special situations were present during the validation count (such as an atypical traffic situation, or an obstruction in the field of view of the Telraam sensor). Of course longer time series will provide better validation.
Validation of the speed measurements is also possible, primarily by using radar guns or radar installations. This has also been done - albeit a very limited number of times - by local police. Other methods would include recording videos of the traffic flow between two locations separated by a known distance (e.g. two lines painted across the road surface 20 metres apart), and calculating speeds based on the time it takes the vehicles to travel the indicated distance. We plan on using this method to validate our upcoming new Telraam S2 device.
The accuracy of the original Telraam sensor
Before proceeding with the discussion of the collected validations, we can already give a general overview on what can influence the accuracy of our sensor. See also FAQ article "Potential inaccuracies with Telraam.
Telraam sensors are meant to be placed on the first floor, not too far from the street surface (therefore not behind a very large front garden), with the camera pointed towards the middle of the road, making sure that no road users are left out of the field of view (as much as practically possible), and preferably not near traffic lights with a long cycle. There should be no obstructions (e.g., balcony railing, light poles, constantly parked vehicles, trees, etc.) in the field of view, and no movement that is not related to traffic (e.g. trees with significant visible movement, mirrors reflecting traffic and lights, etc.). As soon as some of these conditions are not fulfilled, that will significantly downgrade the expected accuracy of this Telraam installation. Atypical viewing angles, or obstructions will likely influence not only the total counts, but the performance of the classifier too.
Even a perfect Telraam installation - according to the criteria above - might suffer from temporary adverse effects that can potentially downgrade its accuracy. Some of these are intrinsic to the used computer vision, object tracking, and classification technologies (and cannot be further improved on the original sensor hardware), while others are caused by mostly temporary external factors (which can often not be influenced by the user).
Due to the fact that many parameters influence the final accuracy of a given Telraam sensor, it is practically impossible to give one single value that could predict the accuracy in a specific situation, but from the validation counts that we have received we can estimate the performance in typical conditions. After these values we provide a detailed explanation of the most common inaccuracies and their sources, which separate an optimal installation from a typical or problematic installation. Understanding these will help you as a Telraam user to make sure your installation is as optimal as possible.
In the well documented, most controlled validation cases, the typical accuracy that we see in the collected data is around the 85-90% mark for cars and heavy vehicles in total, while slightly lower for pedestrians and cyclists (any larger deviation points to issues with misclassification and/or not optimal camera coverage, which will be discussed later).
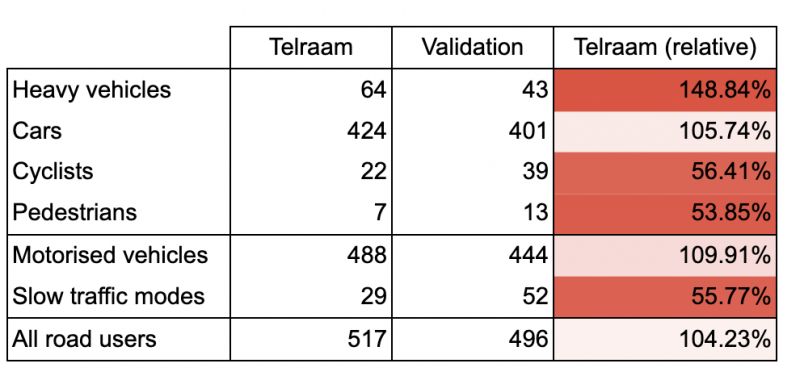
Below is a typical example of a manual validation (done by the local police in Hoeselt) - in this case the totals from four hours over two days are shown. It is clear that Telraam does a very good job concerning the total number of the total road users but some slow traffic is clearly being misclassified as motorised traffic.
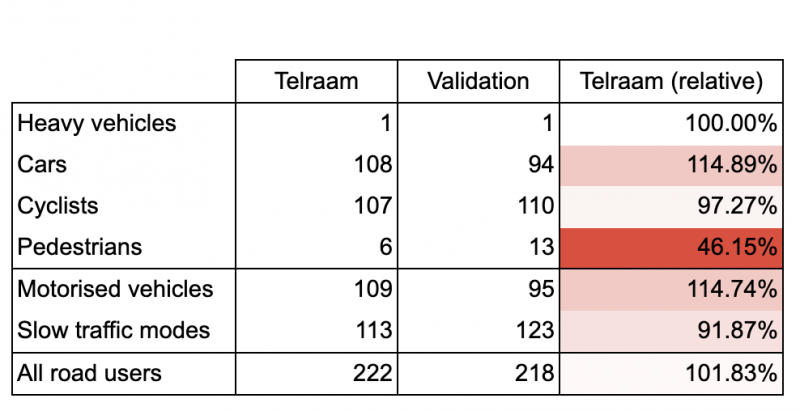
We can safely assume that in optimal conditions the accuracy will be higher, around the 90-95% mark, which is illustrated by a few very good matches in the validation data set. Unfortunately - due to mainly the variable external factors mentioned earlier - it is very difficult to keep a Telraam sensor constantly in optimal conditions, and there is a significant scatter in accuracy in the received validations. An example of a good manual validation over a single hour (by a citizen taking part in Straatvinken) can be seen below (with only minor misclassification across slow and motorised vehicles).
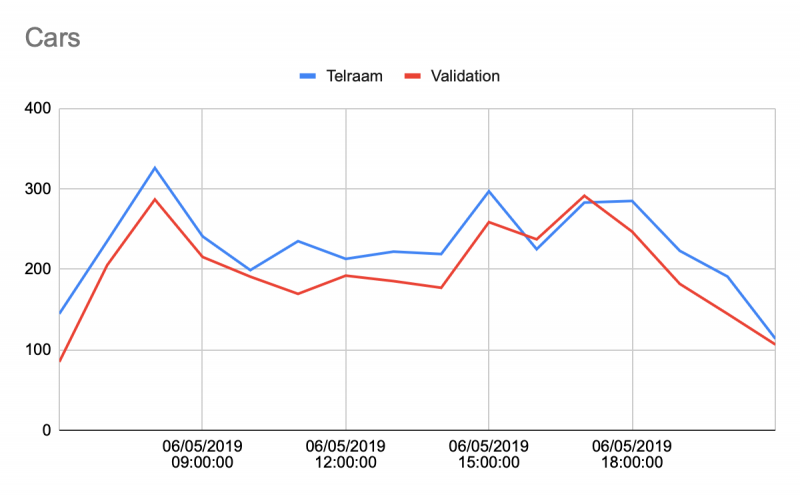
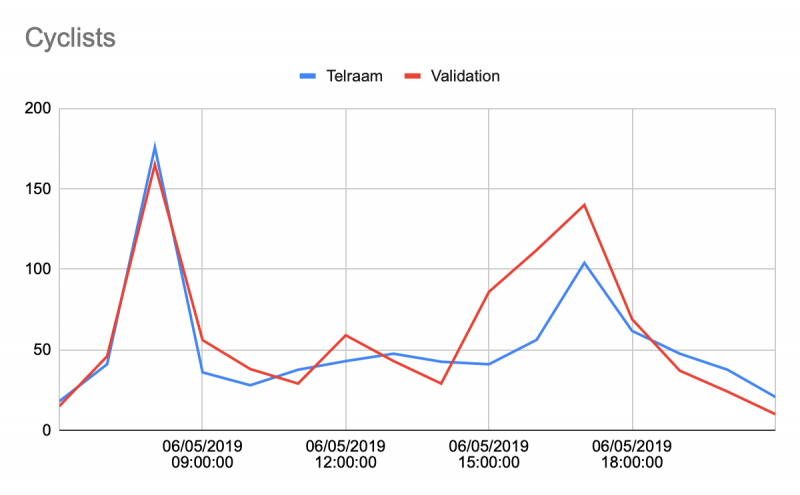
Finally, just as a further example, we show one comparison between Telraam and pressure tube measurements over the course of a full day below, generally showing a good match in the observed trend, and volumes, both for cars and for cyclist
In most cases, while misclassification can skew the modal split to some extent depending on how optimal the Telraam installation is, we can see that the observed number of total road users matches very well (typically within 95%) within the Telraam and validation data. Deviations mostly occur when the Telraam sensor cannot see the whole street properly.
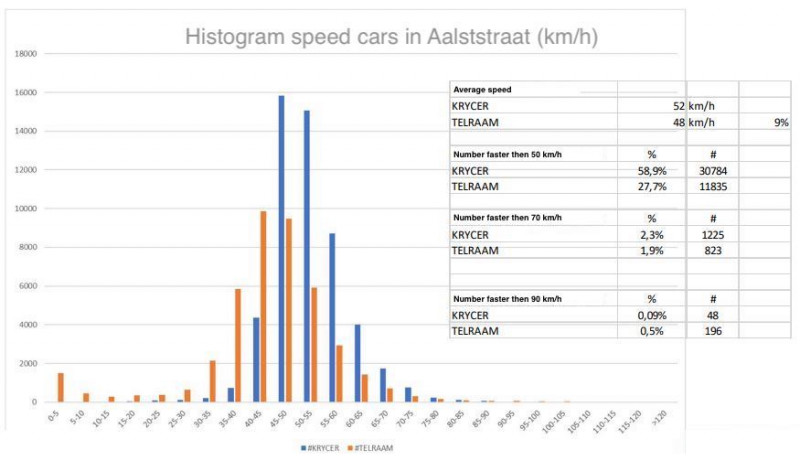
Finally, concerning the derived speeds, we have only two validations (using radar), but these suggest that Telraam underestimates the speeds by around 10%. We have one example available, comparing speed estimates of Telraam with a high-end system (see image below). We would need more data to confirm this.
Potential inaccuracies and their sources
We can provide a comprehensive list of the most common inaccuracies that might be found in Telraam data, along with their potential root causes. As a user you should try to eliminate these root causes as much as practically possible, to achieve the best possible accuracy with your device.
Inaccurate road user totals
The easiest to validate number is the total number of road users over the period of an hour. No matter how well the classification performs (see more in this below), this is the first value to consider when comparing Telraam data and validation data. In optimal cases Telraam should be very accurate in this regard, as the computer vision and tracking algorithms handle single road users extremely well (practically without error), irrespective of their size and speed (under 120+ km/hours). What are the possible reasons behind observed deviations that are larger than a few percent?
The Telraam sensor cannot see the whole road surface. In narrow urban environments it is often the case that it is practically impossible to place the complete width of the street in the field of view of the Telraam sensor. In this case the person who carries out the validation counts should only count those objects that are expected to be visible in the field of view of the Telraam sensor too, otherwise a discrepancy is unavoidable, and data recorded like this should not be considered for validation.
Obstructed and merged objects. When objects - travelling parallel (in the same or opposite directions) in two neighbouring lanes - seemingly (partially) overlap from the sensor’s point of view, the computer vision algorithm only sees the (merged) union of these two objects, and cannot differentiate between the separate road users anymore. While this situation only happens often on roads with a very high traffic volume and is typically not an issue when the lanes are relatively wide and the Telraam sensor is at a good height above the road level, in general this will also lead to count discrepancies, even if the tracking algorithm can handle some of these cases.
Traffic jams with standing still traffic, or long cycle times at traffic lights. Due to the applied technology, the original Telraam sensor works best when the traffic flow is uninterrupted, continuous, and relatively constant (over a period of at least 10 minutes). If there are long cycles of standing still traffic, that will cause significant issues for the device, as - at least sometimes - standing still vehicles will fall into the calculation period of the median background (that is used as a reference during the active counting periods), which will make the next counting period likely completely inaccurate.
The sunshade is not installed (and the Telraam sensor is in a Sun-lit window). Without the sunshade, there will be various internal reflections (between the window layers) in the field of view of the Telraam device, and that will typically result in a significant undercount of the passing road users, as the slowly moving internal reflections interfere with the detection of the actual objects.
Inaccurate classification (and modal split percentages)
Even if/when the count totals match, the modal split of the different road user might be different seen by Telraam, compared to the validation counts. What are the potential reasons for this?
Very low or high camera view angle. In typical streets this should not happen, but if the angle of the camera of the Telraam sensor is very different to what it is expected to be from a typical 1st floor window (e.g., the device is installed on the ground floor, or much higher, or the 1st floor window is very far from the street due to a large front garden, etc.), then the observed properties of the road users that are used during the classification will differ too much from what is expected, which will result in misclassifications.
Long, strong shadows. Long, contrasty shadows typically happening on the mornings and evenings of very clear days, or in the winter throughout the day when the Sun is low, can confuse the computer vision algorithm, which is then not able to separate the shadow from the road user itself, thus they will be observed with a potentially strongly modified shape (width and or length). Since classification depends on these observed properties, misclassification can easily be the consequence.
Obstruction, or tight grouping of road users. Similar to the shadows, merging and object obstruction will influence the individual object properties, and this will likely cause misclassification. A typical example is a group of cyclists (or just two cyclists cycling next to each other), which will most likely be perceived as a car, cars, or as a heavy vehicle (depending on the size and density of the group). Similarly a row of parked cars obstructing the bottom part of a cyclist passing behind (practically leaving only the upper body visible) will cause this road user to be seen as (a fast) pedestrian.
Atypical vehicle composition. As the cutoff between heavy vehicles and cars is derived from the size distribution of the observed motorised vehicles, if the street only contains cars or only contains heavy vehicles, the derived cutoff will be incorrect, and in both of these cases some of the objects will be classified as cars, and some as heavy vehicles (even though only one type was actually present). Similarly if a road is only used by cyclists, but due to occasional merging discussed above some of them is classified as cars, then some of these pseudo-cars will even be split up into heavy vehicles, and the end result will be that even heavy vehicles are counted on a street that is only used by cyclists.
Inaccurate speeds
While this is much more difficult to validate or control than counts, we are aware that there are intrinsic reasons why our speed estimates might sometimes be less accurate than at other times.
Atypical vehicle composition and/or misclassification. We have already seen that atypical vehicle composition can lead to misclassification, and misclassification can lead to vehicles with other than expected lengths to be mixed in with cars. Since the speed determination of cars assumes that we observe a car distribution that is centred around the typical car size, if this distribution is shifted by the inclusion of vehicles of other sizes, then that will introduce a false bias into all the derived speeds. For example, if two cyclists side by side are misclassified as a car, then an object half the length of a typical car is added to the group of cars. If any misclassification adds objects to the group of cars that are actually not cars, that will degrade the accuracy of the speed data. Therefore any source of misclassification can be regarded as a source for inaccurate speed measurements. Moreover, currently we are using the typical average car length of the Belgian market, which will work well for Western European countries, but it will be definitely less suited for, e.g., the USA (where cars are significantly larger), which will mean that the speeds on Telraam installations in the USA will be somewhat underestimated.
Inaccuracy due to low device uptime:
A lot of constant movement (noise) in the field of view. The Raspberry Pi-based Telraam sensor operates at a typical uptime of around 80% in optimal cases (and in practice, half of all the hourly data in the Telraam database has uptime values between 74% and 82%), meaning that this portion of the time is used for actually counting road users on the street. The remaining 20-25% of time (referred to as down time) consists of the reference background calibration, object tracking, and data communication. The first and the last task always takes up the same amount of time, but the object tracking part can become very time-consuming when the number of simultaneously detected objects starts to rise. This means that streets with very high traffic levels can have lower uptimes (especially when a lot of cyclists and pedestrians are also present, since many more of these road users can fit into the field of view, compared to the much larger motorised vehicles), but the biggest issue is usually caused by moving vegetation, which is constantly detected on every frame (often as multiple small objects), creating an unnecessary load on the tracking algorithm. The reason why this matters is that to estimate the actual traffic that we would see if we could operate at a 100% uptime, we need to correct the number of objects that the Telraam sensor sees for the downtime (by a simple multiplication with 1/uptime). If the uptime is 80%, then this is a correction by 1.25, but if it is 50%, then it is a correction by a factor 2, and if it is 25%, then it is a correction by a factor 4. This correction only works well if we can safely assume that the flow of traffic in the non-observed part of the hour was the same as it was in the observed part, which is a reasonable assumption to make when a large part of the hour was actually observed, but it might not be true if only a small part was observed (especially if the traffic flow at the given location is more random and fluctuating in time, or simply has a low volume), so the degradation of accuracy is expected to be worse with growing downtime.
Short first or last hour of the daylight. It happens often that the first or last hour of the day when the Telraam sensor can already or still count, is not a full hour, but maybe only the last 5 minutes of a morning hour, or the first 5 minutes of an evening hour (before full darkness sets in). This creates an artificially low uptime for the whole hour. E.g., in case only the first or last 5 minutes are bright enough to count, even with an 80% intrinsic uptime the sensor will only have counted for 4 minutes out of the 60, so the correction factor that will need to be applied for the whole hour is 15. Especially around the peak hours (which often coincide with the twilight hours), it is very unlikely that the first or last 5 minutes of a given hour will be representative for the whole hour, therefore the corrected hourly value will likely be (unpredictably) inaccurate. This is why when the uptime is less than 50%, we advise to not use these measurements, and we also display these with a much lighter colour across the Telraam website.
It is clear that many of these listed potential error sources are related to another, and that the most important factor towards achieving high accuracy is the optimal placement of the Telraam sensor. If you're feeling excited to start validating some of your own data, we invite you to the step-by-step 'Validate your own Telraam data' FAQ article. Want to share your results? Please do so by mailing them to support@telraam.net.
(Author: Dr. Péter I. Pápics)