Insights from Telraam data - a case study of an Island in the Netherlands
• Written by Wouter Florizoone on 9 April 2024
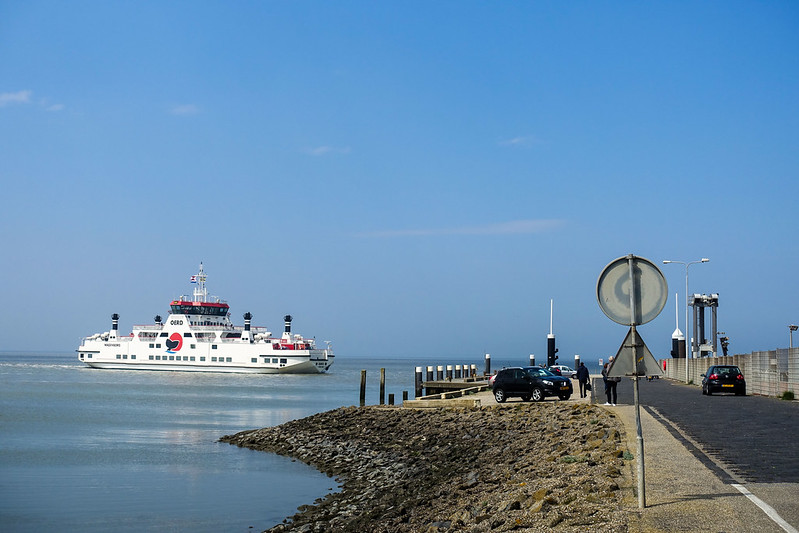
One of our more interesting and “out of the ordinary” projects must be the Telraam network in Ameland.
Ameland is a bit special. An island in the North Sea, in the North-West of the Netherlands and ONLY reachable by ferry with a fixed schedule. It’s a hotspot for tourism during summer when it’s nice and warm. Residents have the islands mostly for themselves off-season.
The municipality of Ameland is using Telraam for a specific purpose: to measure the seasonal variation of traffic on the island, both car and bike traffic.
Now, as you can only get to the island using a ferry service, the island is fairly small (so very much bikeable) and the capacity for cars on a ferry is limited (and expensive), the “influx” of cars is clearly constrained, much more so than for bikes. So let’s investigate how big this impact really is. Is the impact the same over the island?
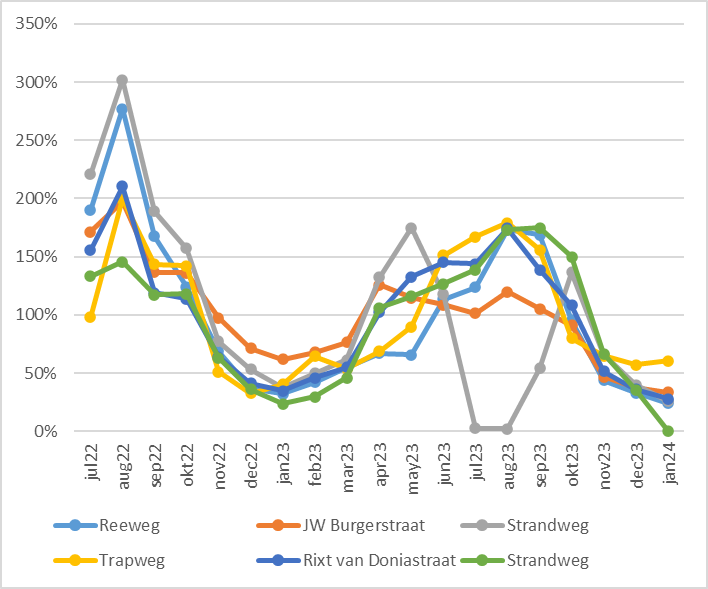
We prepared a limited analysis for the municipality of Ameland after +/- 1.5y of data gathering. We use the median traffic volume per hour per month as a metric to compare the different months over a long time series. That’s the median value of +/- 250-450 data points (depending on the hours of sunshine per month). The median is a good metric here, as there’s plenty of data and the median nicely filters out any anomalies or outliers. We’re doing this for 6 road segments which had (almost) uninterrupted data collection from July ‘22 to January ‘24.
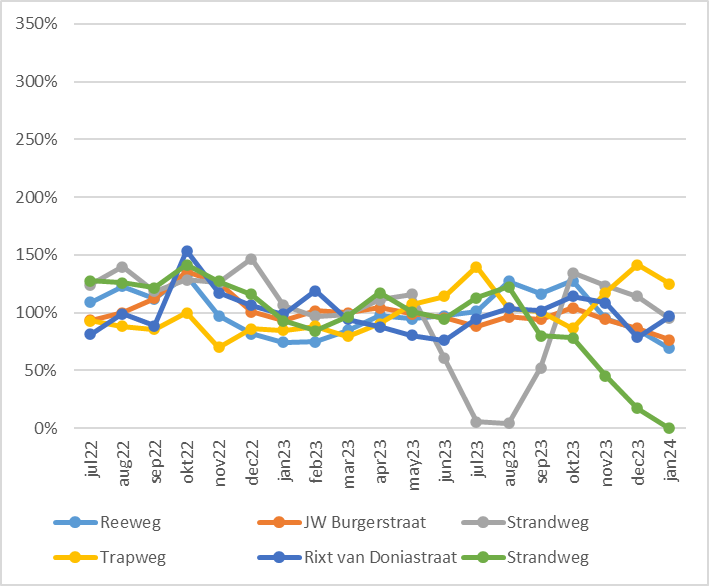
We’ve done this separately for cars & two-wheelers, to see if there’s a difference in behaviour for the 2 modes and we first do this in absolute volume, so you can see which streets are busier/calmer than other and normalised to the average over the 19 months per segment, so you can see the relative difference per month for each segment on the same scale.
Let’s show you what we’ve found and discuss...
Here is the overview for car traffic, in absolute numbers :
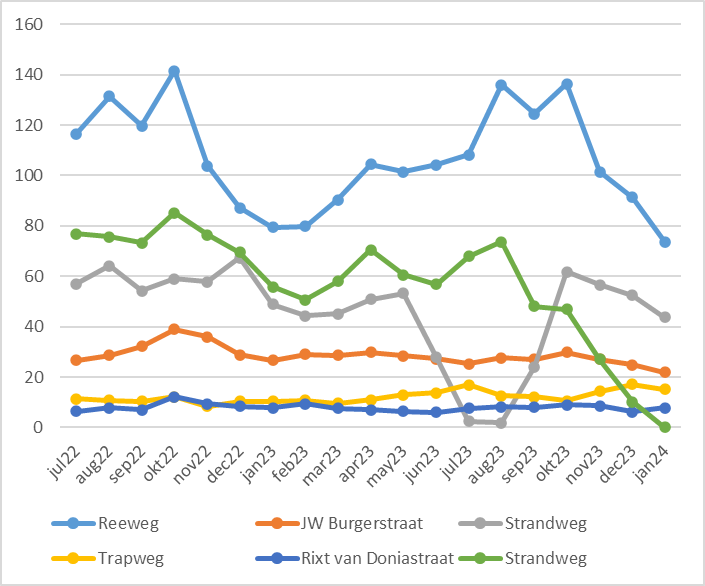
- Car traffic is low in Ameland. The busiest road has +/-120car/h, that’s 2 cars per minute…
- Car traffic is almost the same all year round (!). It’s hard to spot any seasonal variation at all.
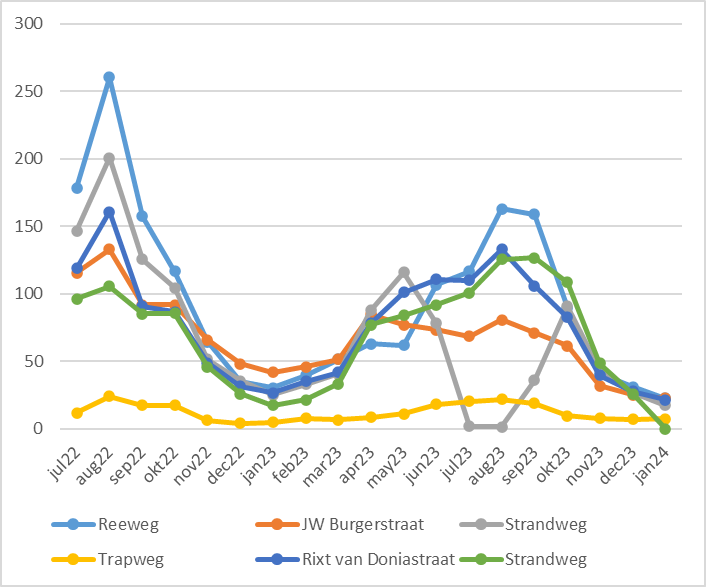
- There’s definitely more cycling traffic in Ameland than cars.
- Bike traffic is HIGHLY seasonal; peaking in July/August, easily 3x as many as during winter.
- August ‘22 seems to have been particularly busy.
The results of these findings were explained and discussed with participating residents in Ameland in a participatory setting.
Over the period of more than 1 year, these residents installed a device at their homes to count traffic in a multimodal way. The set-up was preceded by a call, selection process (in cooperation with the Ameland municipality's mobility service) and an installation workshop that provided very detailed installation instructions (such as a clear view, height, distance, etc.) with the participants.
The counts were always available for transparent consultation on our website.
The municipality has used the data for various insights, herewith a brief response from the mobility officer : "Currently, the traffic counts are mainly used in the analysis for the transport vision. It is easy to deduce from the figures which events bring a lot of traffic to the island. This can provide input for the event policy that is still to be drawn up. The counts were also used in combination with a risk inventory to identify bottlenecks in traffic safety. With that inventory, a subsidy was obtained to solve these bottlenecks. Traffic calming measures in Buren, for example, are drawn up together with residents. In short: the help we received from the residents proved to be very valuable!"
Our conclusion
Long-term, permanent traffic counts serve as indispensable tools for urban planners, mobility experts and policymakers alike. By providing comprehensive data over extended periods, they offer invaluable insights into traffic patterns, infrastructure usage, and the efficacy of transportation interventions. These counts facilitate informed decision-making, enabling stakeholders to design sustainable transportation systems, alleviate congestion, enhance safety, and optimise resource allocation for the benefit of communities and economies at large. Thus, prioritising the collection and analysis of long-term traffic data is essential for fostering efficient, resilient, and equitable urban mobility solutions. So that is exactly what we have been able to demonstrate here in Ameland as well. We are pleased that Ameland will continue to count with our technology and look forward to new reports in the future.
