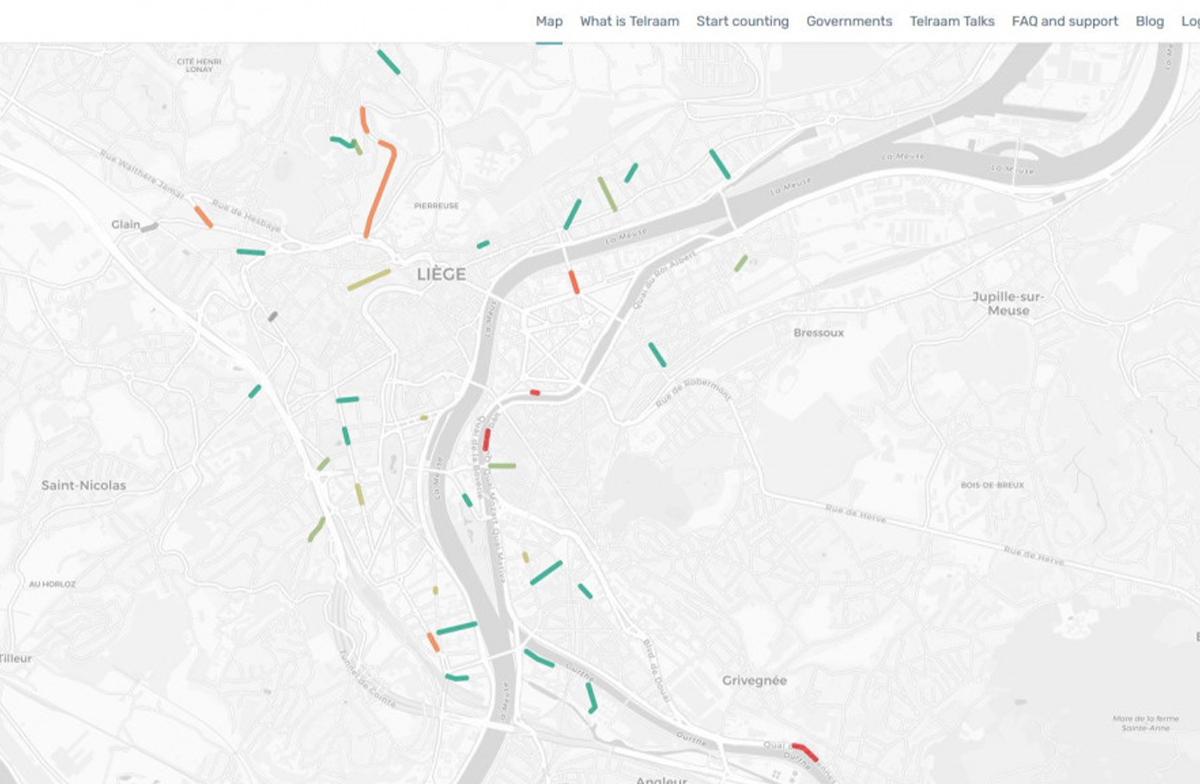
Are you a fan of live traffic data, and you like maps too?
Update API • Rédigé par Wouter Florizoone sur 6 October 2021

This means that if you want to create a visualisation similar to what can be seen on the opening page of the Telraam website - for your own pleasure, or maybe for an application you are building - then you can get all necessary information with the help of this API. The full technical details - as always - can be found on our API documentation page at https://documenter.getpostman.com/view/8210376/TWDRqyaV#476370b0-48be-4092-8930-11be1990b35c, and a list of new features (compared to our existing APIs) are summarised below :
- First of all, this API returns not only traffic counts (like our standard traffic API), but also the geographical coordinates that define the segments, therefore it is possible to make Telraam maps (live or historical) by using nothing but this call (without the need to make further requests to get the geographies of the segments using, e.g., the segment by id call).
- Secondly, it is now possible to request live measurements without actually specifying the actual time. This makes creating a live traffic-tracking and mapping application much easier, since the timestamp does not need to be specified on the user end. In other words, you could build a small app that shows the live Telraam traffic of, e.g., the neighbourhood of Leuven, without actually having access to any time and time zone information.
- Lastly, while previously it was only possible to request traffic data for specified segments, here you do not need to specify the segments by ID anymore, instead you can use a bounding box or bounding circle, or even request the information of all segments in one go (for a single hour, live or historical).
We hope that you already have some use-cases in mind for this new API, and we are looking forward to see your fine visualisations and applications that will come in the future.
Should you have made something cool, reach out to us in a message or use the tag #TelraamAPI on social media.
As you can see, we are constantly trying to further optimise the way Telraam works !