How accurate is Telraam? A three-way counting comparison puts the numbers to the test
•
Kris Vanherle
16 March 2026
Traffic counters are only useful if you can trust what they tell you. At Telraam, we collect a lot of anecdotal feedback from users who find our counts plausible — but we rarely get the chance to put our sensors side-by-side with other established technologies for a direct comparison. That's exactly what happened recently when we were given access to a dataset that included simultaneous counts from three very different counting methods at the same location. We couldn't resist digging in. Dig in with us!
The setup: three technologies, two streets
Comparisons were done on two distinct sites:
Site A: A quiet, mixed-use street in Belgium, with almost as many bikes as cars. The street is used mostly by commuters, and sees a lot of cyclists travelling to school. At this site, traffic was counted simultaneously over 17 days using:
Pneumatic tube counters (the standard for short-term road surveys, used widely by traffic engineers)
A radar-based counter
A Telraam sensor
Site B: A typical side street in a city centre in the UK, not a main artery, but linking a residential area to the main road network. More traffic than Site A (and almost exclusively cars), but well below the volumes of a primary road. At this site, a shorter 8-day overlap compared a tube counter with Telraam only.
This kind of multi-technology comparison is genuinely rare — and extremely valuable for understanding where each method agrees, and where it doesn't.
Site A: hourly time series and daily patterns
The first thing we looked at was simply the hourly count lines plotted over time — all three sources on the same chart, for cars, cyclists, and totals.
siteA_plot1_timeseries.png663.29 KBThe picture is striking. For motorised vehicles, Telraam and the tube counter track each other closely across the whole 17-day period, including through morning and evening peaks, quieter weekend days, and night-time lows. The radar signal follows the same general shape, but runs noticeably higher for much of the recording — particularly during peak hours.
For cyclists, the contrast sharpens. Telraam and the tube counter continue to follow each other closely, while the radar reads dramatically lower. This is not a small difference: the radar is consistently missing most of the cycling activity that both other methods pick up. It seems the radar is misclassifying most of the bikes as cars, though this does not fully explain the spikes of radar counts (see day 8, 9 and 14).
This pattern becomes even clearer when looking at the average hourly profile derived from the full time series:
siteA_plot2_hourly_profile.png195.39 KBThe Telraam and tube curves are nearly overlapping for both cars and cyclists, with the characteristic morning and afternoon peaks well-matched in timing and magnitude. The radar's motorised profile peaks significantly higher, while its cycling line barely rises above zero — a systematic divergence rather than random noise.
Scatter plots: putting a number on the agreement
To quantify how well the methods agree hour by hour, we produced scatter plots where each dot represents one hour of counting, and perfect agreement falls on the 1:1 diagonal line.
siteA_plot4_scatter.png206.44 KBTelraam vs. tube — cars: R² = 0.943, slope = 1.03. The data points hug the diagonal almost the entire way, and the slope tells us Telraam counts essentially the same number of cars as the tube — a 3% difference over the full dataset, within normal measurement uncertainty.
Telraam vs. tube — bikes: R² = 0.979, slope = 0.96. Even tighter agreement. Across the full time series, the tube counter registered about 4% more cyclists than Telraam — again, well within acceptable tolerance for this type of sensor.
The radar scatter plots look quite different. For cars (R² = 0.674, slope = 0.71), there is a systematic under-count of around 30% compared to the tube, accompanied by considerably more spread. For cyclists, the comparison is essentially meaningless: a negative R² value and a slope of 3.44 indicate that what the radar is classifying as "cyclists" or "two-wheelers" does not correspond well to what either the tubes or Telraam is measuring. The most likely explanation is that a significant number of slow-moving or small motorised vehicles are being miscategorised, inflating the motorised count and depressing the cyclist count simultaneously.
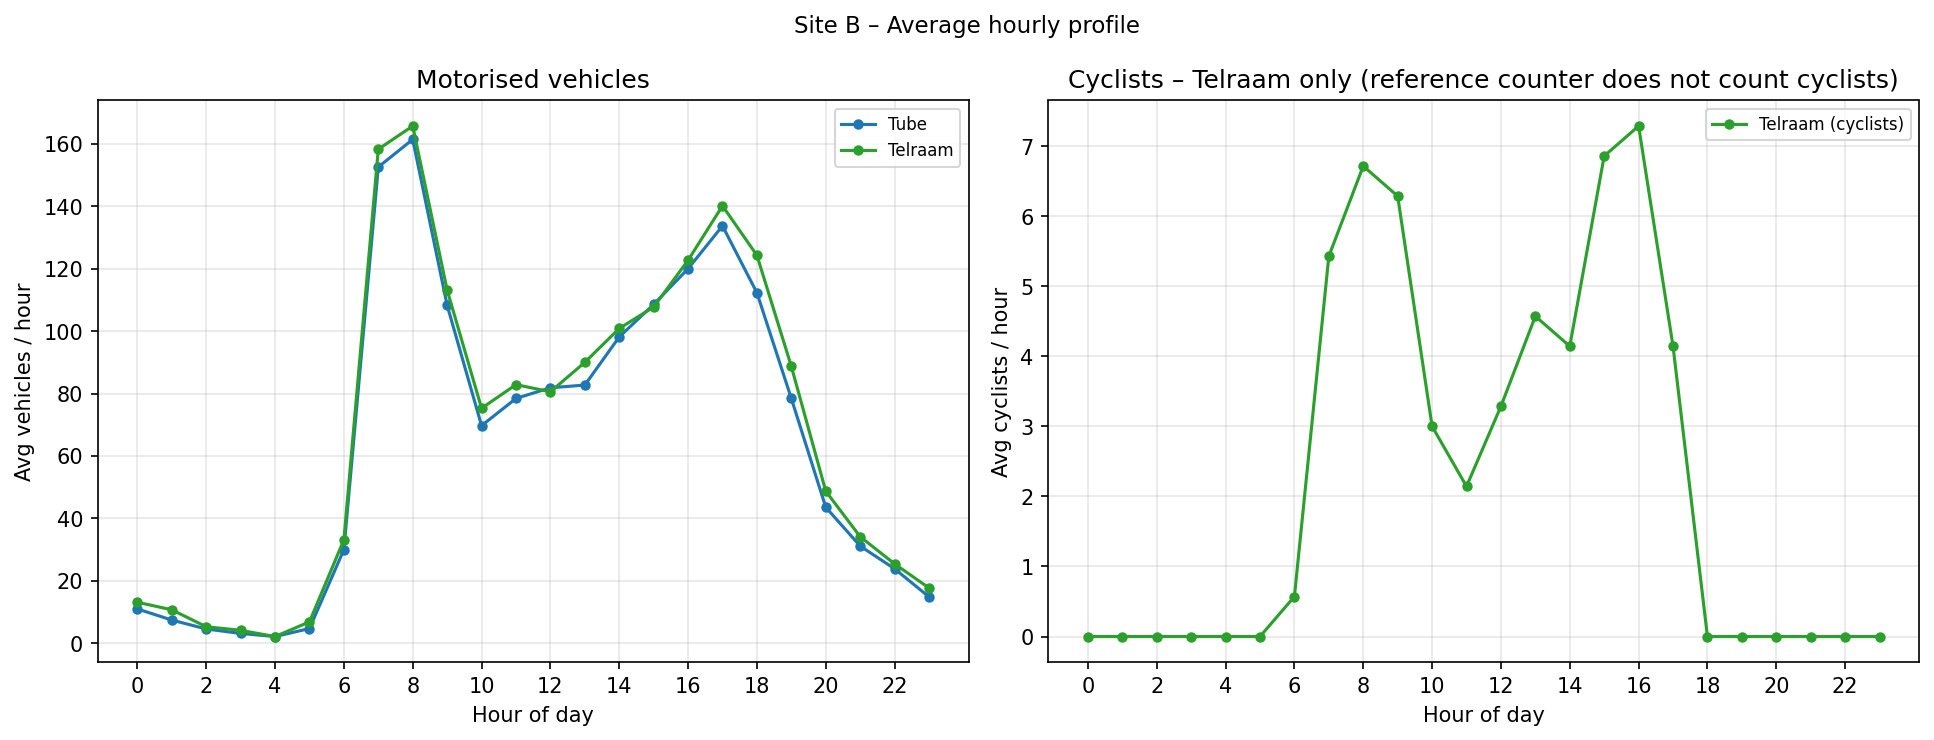
Site B offered a more straightforward comparison — just tube counter and Telraam, over 8 days on a busier road with peak counts reaching 300 vehicles per hour.
siteB_plot1_timeseries.png234.04 KBThe two lines are almost indistinguishable. The average hourly profile confirms this:siteB_plot2_hourly_profile.png119.14 KBR² = 0.985, slope = 1.04. On a site with substantially higher traffic volumes, Telraam is tracking the tube counter with remarkable consistency — a 4% overcount overall, steady across the full range of hourly volumes from quiet overnight hours up to the busiest peak.
A note on night-time counting
One additional finding is worth highlighting. In the Site A time series, Telraam's "day+night" total (which includes objects detected using headlights during dark hours) aligns closely with the tube counter's total, even overnight. This confirms that Telraam's night-time counting does capture cyclists alongside cars during dark hours, something that's sometimes questioned given the headlight-based detection method. The agreement with the tube data suggests that night-time counts are not systematically inflated or deflated.
Conclusions
Across two sites and 25 days of combined overlap data, Telraam and pneumatic tube counters agree to within 3–4% for both cars and cyclists, a result that is consistent with the accuracy range typically cited for well-installed tube counters themselves and also confirming our own validations we did when we launched the Telraam S2 sensor. The technology does what it is supposed to do, with a consistent bias that is small enough to be well within the needs of most traffic monitoring applications.
These results also reinforce something we observe consistently in our network: installation geometry matters. Both sites in this comparison had good lines of sight and appropriate distances between the sensor and the road being measured. When those conditions are met, the data quality shows.
We are grateful to the partners who collected this data and made this comparison data available for us.
Do you have comparison data from your own Telraam deployment? Or do you want to access to this data so you can verify the accuracy yourself? We'd love to hear from you at info@telraam.net.