Spotting unexpected trends in continuous monitoring with Telraam in the USA
• Robert McIntosh 12 June 2025
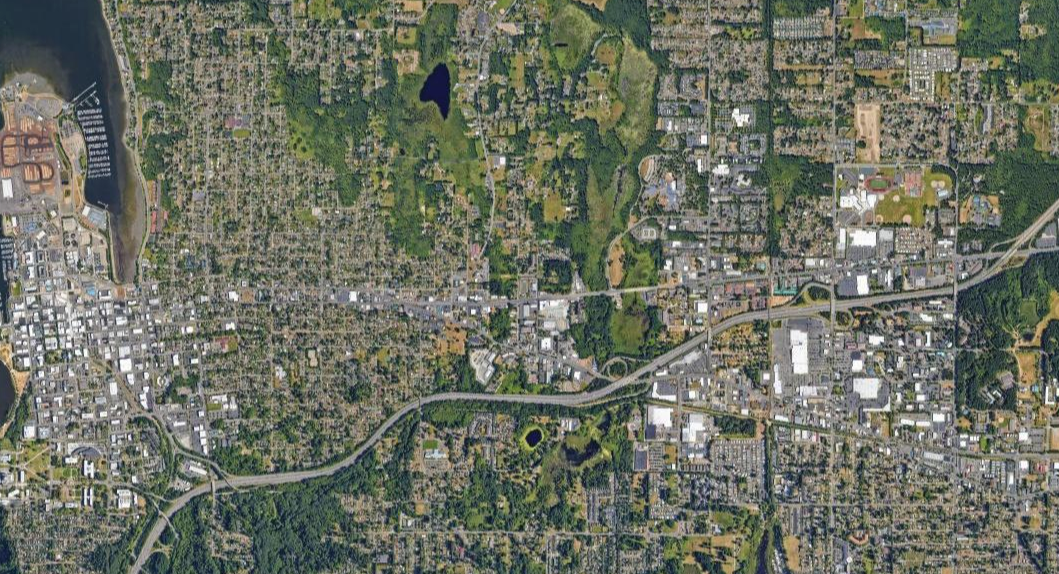
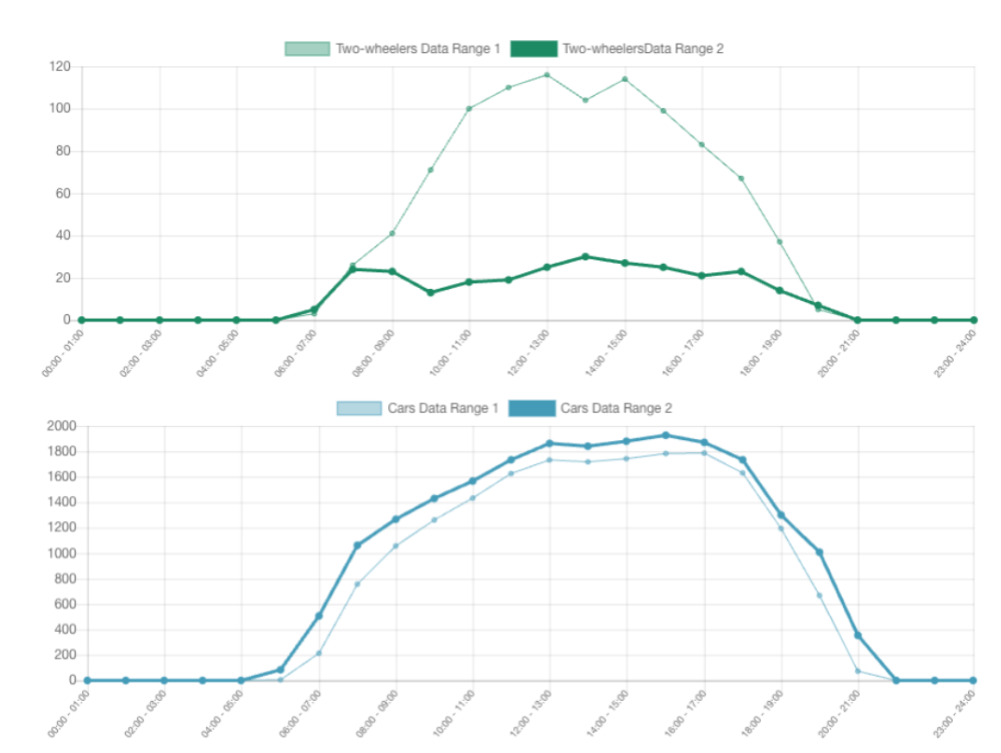
As this was a trial, only a small number of devices were installed, and two locations were chosen for monitoring (location 1 - location 2). Both locations showed a very high number of cars and large vehicles, since the road had been a highway but had since been replaced with a more modern multi-lane highway, downgrading this road to a more local interconnection, but retaining the long, straight roads and limited active travel infrastructure.
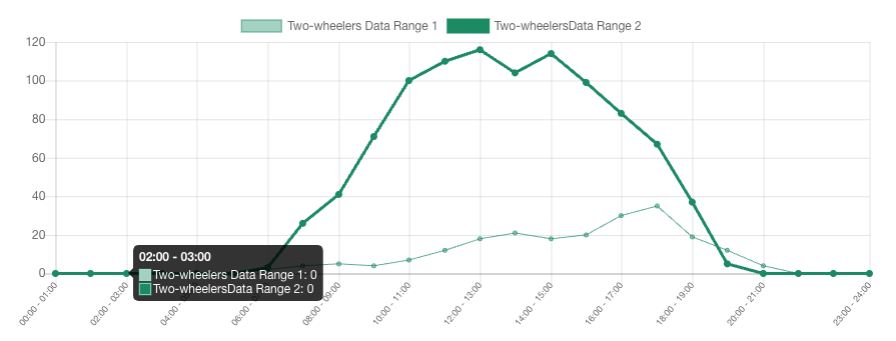
One thing emerged shortly after installation which caught the team’s attention which was a big, and unexpected, discrepancy between the cycle counts on the two locations. There was no particular expectation that this would be the case, and it was something that deserved attention to ensure the data was being captured correctly.
On closer examination it was noted that the second device was located before a section of the road passing near a park. This park not only offered some limited cycle pathways, but also the local University campus.
The target street only had a narrow painted cycle lane and the team had not expected a high number of users. Not only was this not the case, but the continuous monitoring showed that this number varied over time to match the university calendar, dropping considerably during the Easter holiday and at the end of the semester, demonstrating that there was a likely connection with student travel activity.
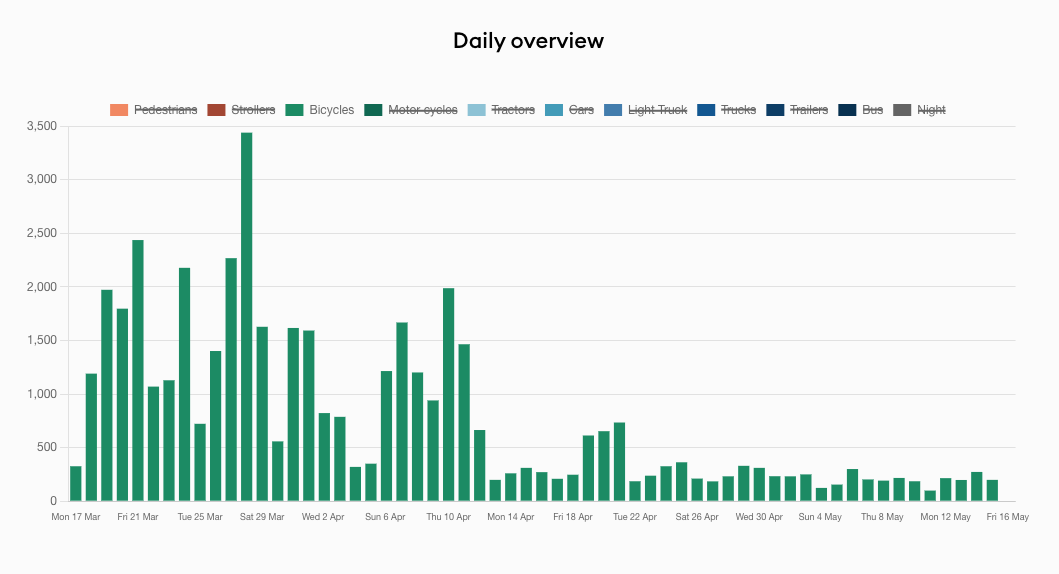
This clearly demonstrates the benefit of continuous monitoring rather than a short term snapshot of a week or two for discovering unexpected travel patterns, as the data capture may otherwise miss a changing pattern such as the term-time differences.
We hope this data will also be used to demonstrate the need for better cycle infrastructure on this section of the target road to ensure the safety of students cycling, and needing to cross a road with a very high level of vehicle traffic.